Conservative Stock Picks
Solid, profitable recommendations in a turbulent world.

Performance Table and Graphs
Recommendation portfolio's performance
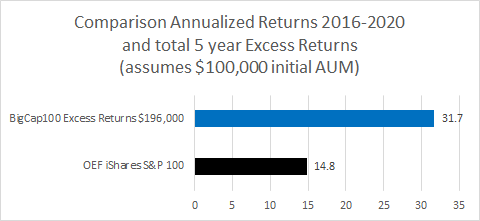
As this graph shows, the five year EXCESS returns (above the returns from the passive index benchmark) would have been $196,000 on an initial principal of $100,000.
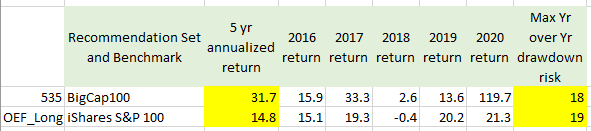
The recommendation portfolio beats the benchmark 4 of 5 years.
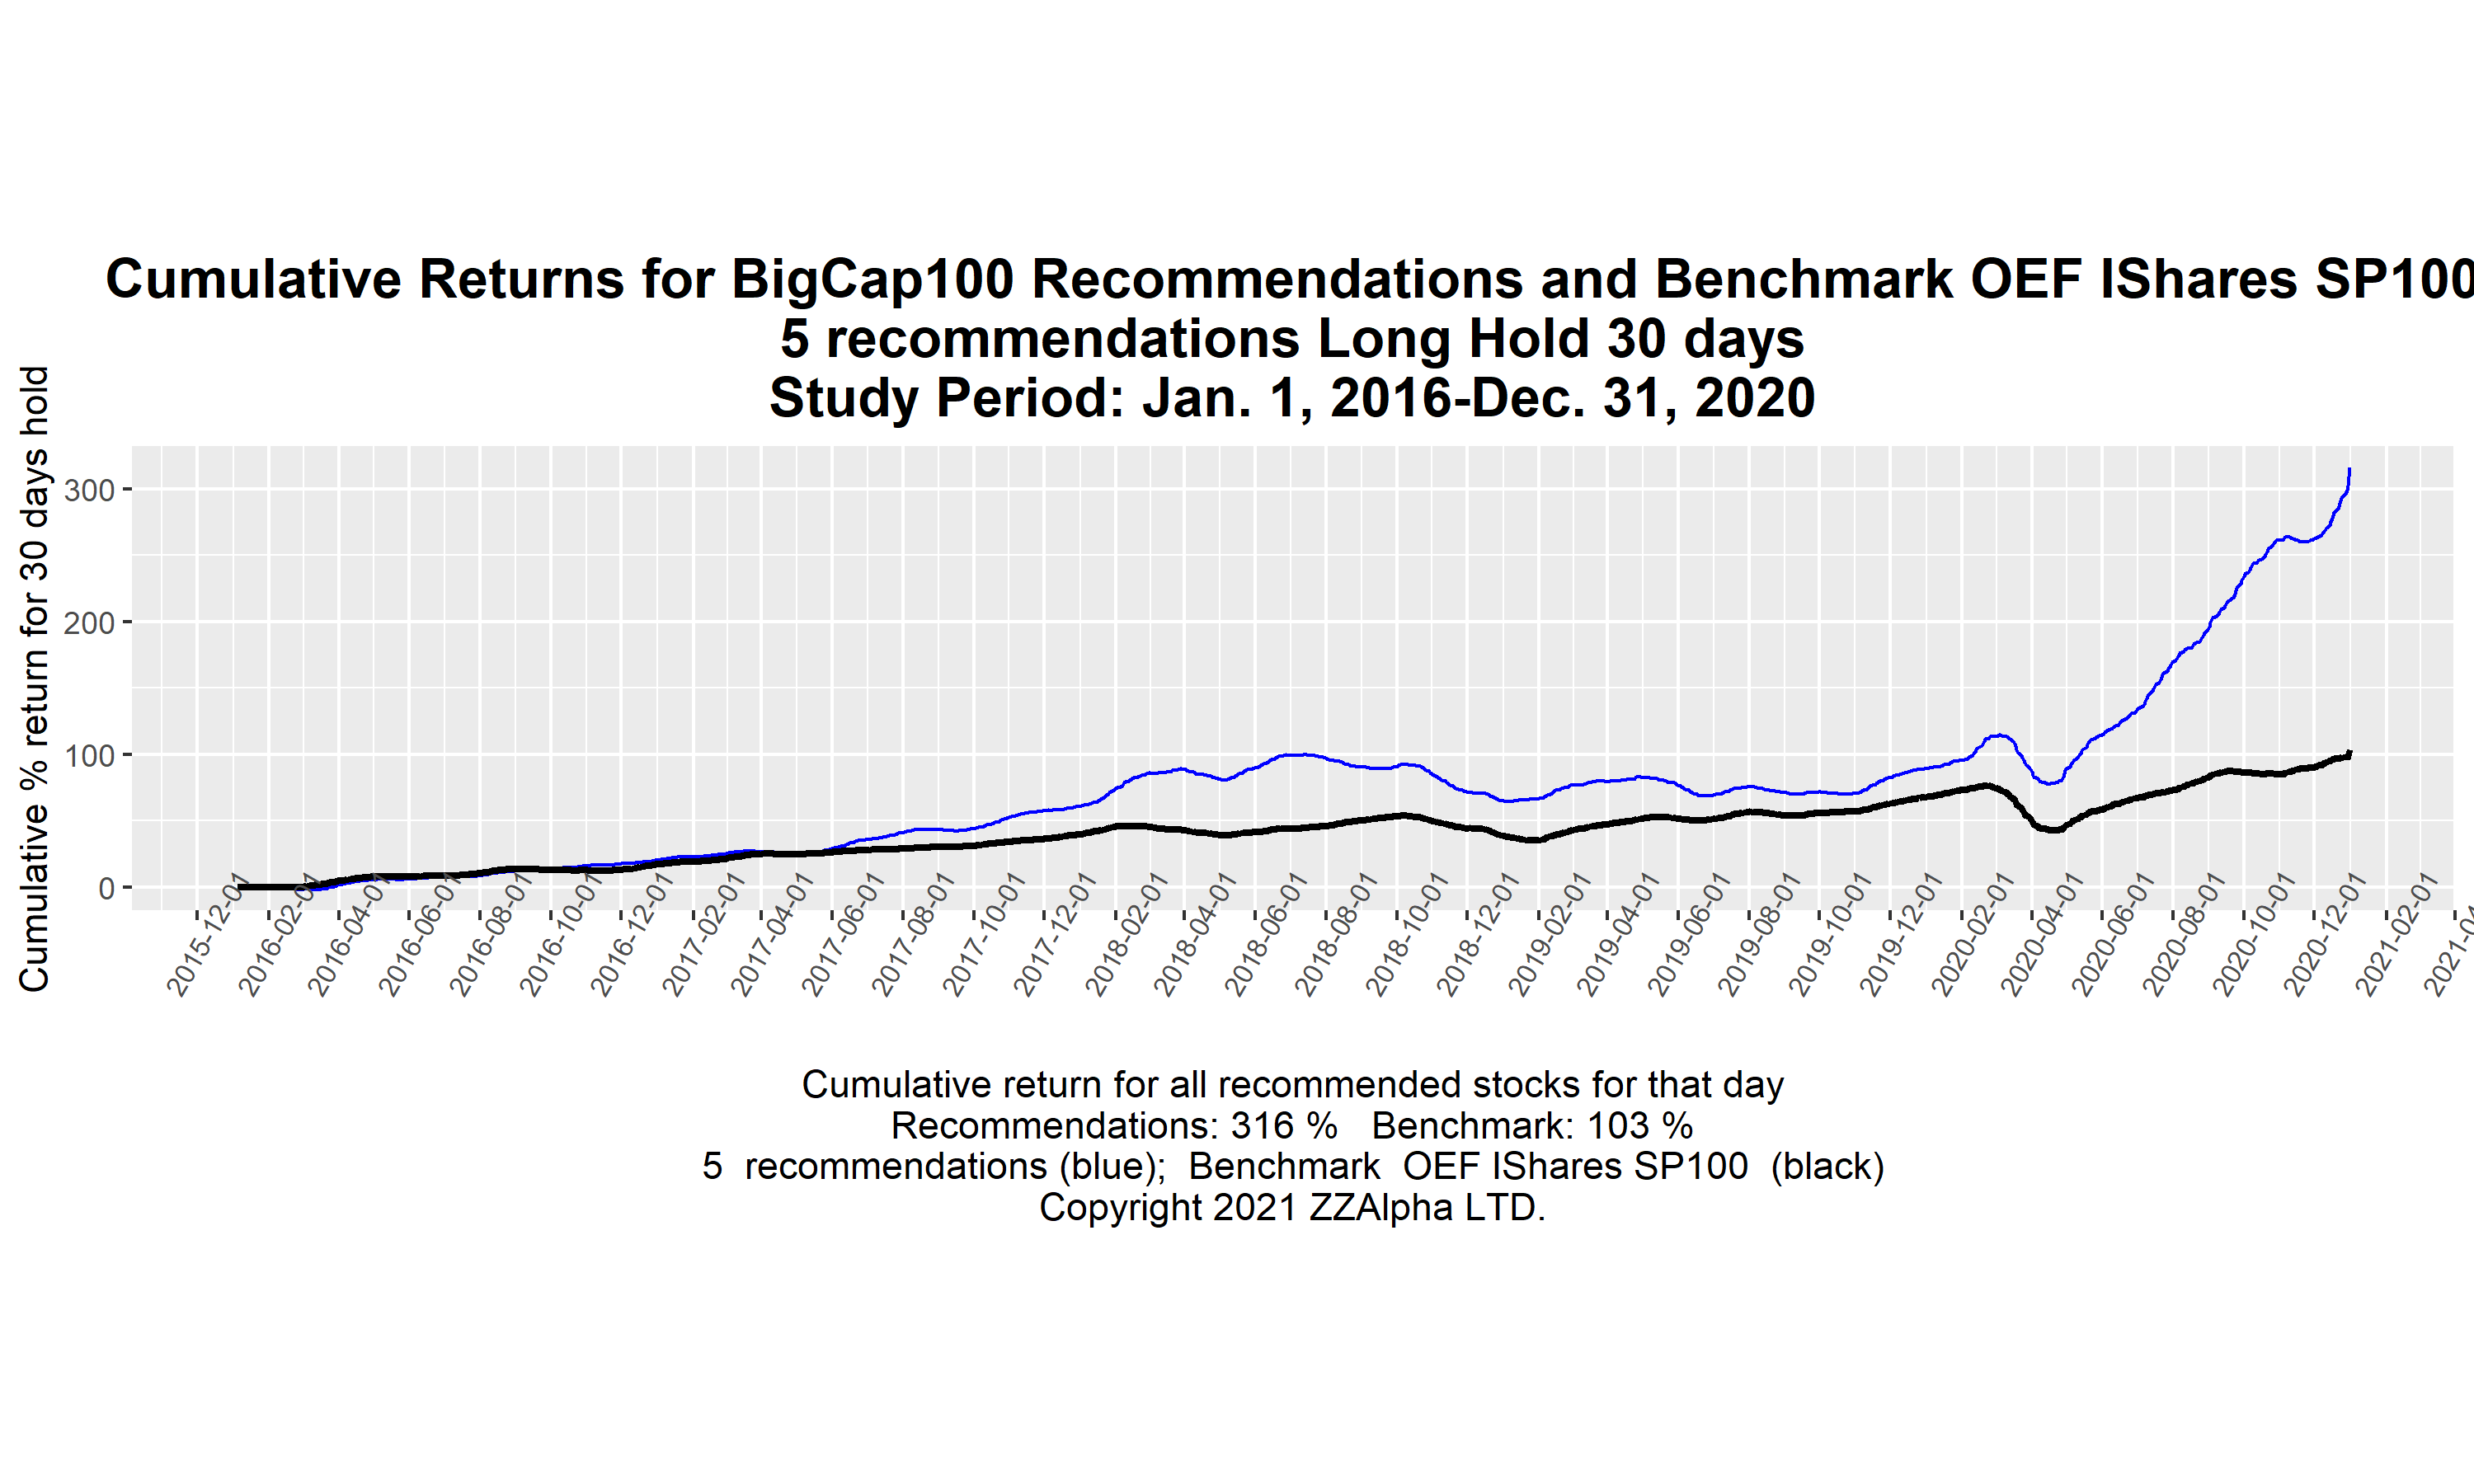
This performance graph -five years-
visualizes historic risks and returns - "past performance" -
against the benchmark. When the value of a line falls
below a portion of the line to the left (looking back up to
12 months), there is risk. Both the benchmark and the
recommendations have risk and rewards.
The returns shown assume investment of equal amounts each day
in each recommended stock, buying at the opening
price the day of recommendations, holding for 30 market days
(about 6 weeks), selling at the opening price on the last day,
and repeating with fresh recommendations. The returns are
calculated assuming a starting portfolio of $100,000 and no
commission.Risk Profile
We also prepare historic risk profiles for each set of recommendations.Positions Win to Loss: 3868 : 2420 Total=6288.
AvgWin to AvgLoss: $139 : $-91.
MedianWin to MedianLoss: $73 : $-53.
Max Drawdown (252 market days): 18% over 1258 total market days. (There are 252 market days in a typical year).
Note the max draw-down risk is 18% which is slightly LESS risk than the benchmark while the annualized return is more than double.